
Beholder of All Ages:
The History
of the World in a French Mappemonde
- Stephen Boyd Davis
_______________________________
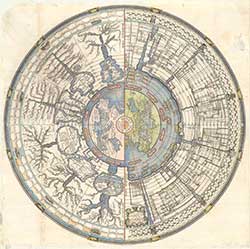
Fig. 3. G. A. Martignoni, Imago Romani
Imperii, 1718 
We can imagine that lists and tables, whether densely packed or spaced in proportion to intervals of time, arose naturally through the increasingly sophisticated layout of writing, and later of typography. In some senses the use of layout and space on the page can be seen as a metaphor for the historic time represented, and in particular, we might regard the direction of reading, down or across the page, as metaphorically representing the direction of time, from the earliest events to latest. However, it is almost certainly not conceived in metaphorical terms by the authors of these texts — surely it just seems to them the obvious way to lay out lists and tables? Inheriting a particular scroll or codex format and a particular writing direction according to their culture, every author assumes that his is the right way to put time into a tablet, scroll or page. Practicalities of layout and printing will also have their effect. There is good evidence that writing-direction affects the orientation along which time is conceived as flowing [19], an important example of the reflexive influence of visual representations on the concepts they represent, further discussed below.
If in the textual mode authors are generally unaware of the role of metaphor in their thinking, in the pictorial mode there is often a conscious attempt to find a suitable graphic metaphor. Within the pictorial tradition, history is assigned various figurative shapes, including chains, trees, the hand, the body, architecture and animals [20]. An important influence was the Biblical account of ‘Daniel’s Statue’ — Daniel’s interpretation of a statue seen by Nebuchadnezzar in a dream as a sequence of ages (Daniel II, 1-49), with its vivid imagery of a head of gold, chest and arms of silver, belly and thighs of bronze, legs of iron, and feet of iron and clay, subsequently interpreted as images of actual historical eras. Indeed this passage is explicitly referenced by Barbeau in his Explication [21]. The use of such pictorial imagery is also familiar from the ars memoria’s use of striking visual images that act as memorable emblems for abstract concepts — in Bacon’s words, ‘what is sensible always strikes the memory stronger, and sooner impresses itself than the intellectual [22]’. A few years before Barbeau, another pioneer of chronographics, Martignoni, was highly dependent on visual metaphor, and discussed it painstakingly in his own lengthy Explication, remarking that,
Plusieurs Hommes sçavans, se sont proposé la même fin en d’autres matiéres, & par de semblables inventions ils ont facilité le moyen d’apprendre, ce qu’il y a dans le Monde de plus curieux & de plus utile. Ils ont, par exemple, imaginé des Arbres, pour représenter les Généalogies; des Cercles, pour faire comprendre les mouvemens des Cieux; des Animaux, comme des Ours, des Lions, des Beliers, des Dragons &c., pour faire connoître les Etoiles, leurs influences & leur situation; d’autres Arbres & des Charriots, pour expliquer quelques parties de la Logique & de la Métaphisique: J’ay même vû la Théologie, Reine des Sciences, figurée dans un Dessin, par des Cercles, des Quarrez & des Triangles.
Several learned men have had the idea of achieving the same end in other matters, and by similar inventions they have eased our manner of learning those things in the World which are most interesting and most useful. They have, for example, imagined Trees to represent Genealogies; Circles to enable the movements of the Heavens to be understood; Animals such as Bears, Lions, Rams, Dragons etc. to understand the Stars and their influences and location; others, Trees and Chariots to explain certain parts of Logic and Metaphysics: I have even seen Theology, queen of the sciences, represented in a Design by Circles, Squares and Triangles [23].
Apparently nervous about the idea of visual analogy, despite its long prior tradition in representing history, Martignoni points out that God himself uses similes and images, as does the Church:
Deplus il semble, que ce n’est pas aux Hommes, à qui on doit l’invention de cet Art, mais à Dieu même, lorsqu’il signifie Soy-même, les Ames, son Regne, par des similitudes & des figures; comme d’une Vigne & de ses ramaux, d’un Arbre, d’un Trésor, d’un Champ &c. Avant cela le même Dieu avoit révélé à la Sinagogue par d’autres figures, tout ce qui luy devoir arriver; & même l’Eglise se sert des signes & des figures, pour représenter les Histoires sacrées, & tout ce qu’il y a de plus salutaire & de plus Saint.
What is more it seems that it is not to Man that we owe the invention of this art, but to God himself; since he signifies Himself, Souls, and his Reign by analogies and imagery; such as a Vine and its branches, a Tree, a Treasure, a Field etc. Before that, the same God had revealed in the Synagogue by other images all that was due to befall him; and even the Church uses signs and images to present Sacred History, and all that is most salutary and most Holy [24].
When Martignoni mapped historic time in 1718, he did so in a distinctly figurative manner. His Imago Romani Imperii (fig. 3) is in a significant sense an imago, a portrait of history rather than a diagram. But if one is to make a picture — or any other visualisation — of time, what should time look like?
Depiction and visualisation
Elsewhere [25] I have characterised the component processes of visualisation, here summarised in a simple linear diagram (fig. 4).
O → I → M → V → P
Fig. 4. A linear diagram of the transformations involved in creating any depiction or visualisation, from the objectives O to the final rendered picture P, via the idea I, model M, and view V.
O represents the objectives of the visualisation in question, the purposes that it serves. These may be many and complex. The objectives may be tacitly shared by a culture rather than consciously held by the maker or makers of the visual artefact. They are the work’s raison d’être. In this simplified linear model, the objectives O are transformed into an idea I, some as-yet-unresolved notion of an analogy or metaphor for the thing or concept to be visualised. This notion of transformation, derived from MacDonald-Ross and Waller [26], occurs at every stage where there is an arrow in the diagram above: at no point should it be imagined that one stage is automatically, transparently or completely transferred to another. To give an example, the idea I might be that of a tree. The objectives O will be very different, dependent on the context. We might, as in the case of the Tree of Jesse and other genealogies, use a tree to represent the topology of family relationships. We might wish to indicate where a tree can most effectively be pruned as an ornamental garden specimen. We might show the kinds of timber that should be selected for particular functions in ship-building. Or we might evoke the sublime character of a landscape by depicting a storm-lashed oak. The general idea I is resolved into a model M, some particular instantiation, some more or less specific tree. If it is to function iconically to represent all possible trees, it may be anonymised as far as possible: M will be relatively abstract. If on the other hand it is to denote some particular specimen, characteristic features are certain to be included; perhaps it is even recognisable as a portrait of some particular tree. As we move towards a graphic image, the model M alone is not enough. It must be viewed from a particular angle, projected in particular ways onto the picture-plane: this constitutes the view, V. Even now, another transformation must occur, as that particular view is rendered in chosen ways as a picture P, for example by adopting particular media such as engraving or painting, by preferring tone or colour, by using drawn lines or stippled textures, and so forth. Whether the final ‘picture’ functions diagrammatically or figuratively, each aspect derives ultimately from the objectives.
Ontology | Epistemology
O → I → M → V → P
Fig. 5. The linear diagram O to P divided to represent, approximately, the ontology and epistemology of whatever domain is in question. The ontology seems to those who hold it to be essentially ‘how things are’, while the means of expressing the apparent reality constitute the epistemology.
[19] Summarised in S. Boyd Davis, ‘History on the Line: time as dimension,’ Design Issues 28(4), Autumn 2012, pp. 4-17.
[20] D. Rosenberg and A. T. Grafton, Cartographies of Time: A History of the Timeline, Op. cit., pp. 39, 50, 57, 51, 55, 80, 91.
[21] J. L. Barbeau de la Bruyère, Explication Générale de la Mappemonde Historique, Op. cit., p. 17.
[22] Bacon, De Augmentis Scientiarum quoted in F. Yates, The Art of Memory, London, Pimlico, 1966 reprinted 1992, p. 358.
[23] G. A. Martignoni, Explication de la Carte Historique de la France et de l’Angleterre, Rome, Rossi, 1721. British Library General Reference Collection C.106.f.19. n.p.
[24] Ibid.
[25] S. Boyd Davis, ‘A Schema for Depiction,’ in K. Van der Waarde and P. Westendorp (eds.). Visible Language 41 (3). Special issue on Visual Metaphors in User Support, 2007, pp. 280-300.
[26] M. Macdonald-Ross and R. Waller, ‘The Transformer Revisited,’ Information Design Journal 9.2 & 3, 2000, pp. 177-193.


